

Which Call Paths Dominate at Runtime: Using Flame Graphs to Visualize it!
By Kaiwan N Billimoria

This week’s CloudPro is a guest special from Kaiwan N Billimoria, the author of Linux Kernel Programming. Kaiwan runs world-class, seriously-valuable, high on returns, technical Linux OS (Corporate and Individual-Online) training programs at https://kaiwantech.com. In today’s issue, Kaiwan walks us through Flame Graphs: a powerful tool to visualize which call paths dominate at runtime and uncover performance bottlenecks.
Cheers,
Editor-in-Chief
Which Call Paths Dominate at Runtime: Using Flame Graphs to Visualize it!
By Kaiwan N Billimoria

Analyzing workloads is something all engineers end up doing at some point or another (or it’s their job description!). An obvious reason is performance analysis; for example, CPU usage may spike at times, causing issues or even outages.
The need of the hour: observe, analyze, and figure out the root cause of the performance issue! Of course, that’s often easier said than done; this kind of work can bog down even experienced professionals...
Borrowing from Brendan Gregg’s wonderful presentation (though old, it’s still relevant):
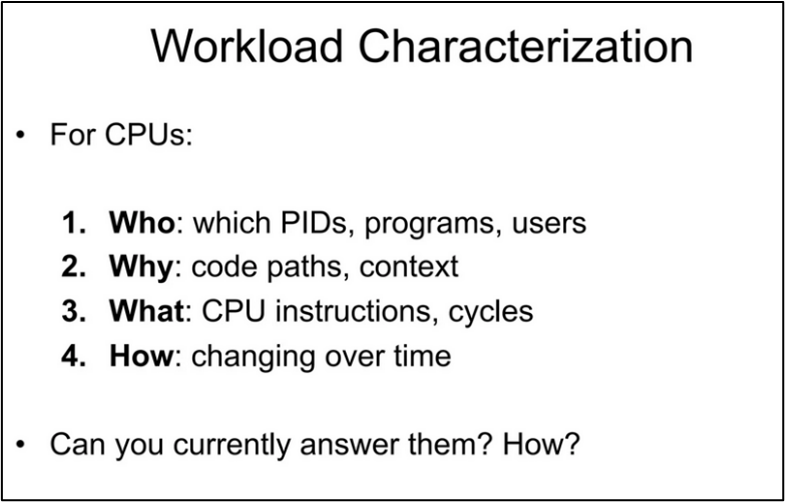
In general, answering the ‘Who’ and the ‘How’ are simple(r):
‘Who?’: well-known tools like top (and its numerous variants – htop, atop, etc) help answer this question.
‘How?’: lots of system monitoring tools are available (vmstat, dstat, sar, nagios, cacti, nmon, iostat, nethogs, sysmon, etc.).
The harder questions tend to be the ‘Why?’ and ‘What?’:
‘Why?’: by generating a Flame Graph! (the topic of this short article)
‘What?’: Flame Graphs as well as plain old perf!
The following slide illustrates this (again, from Brendan Gregg):
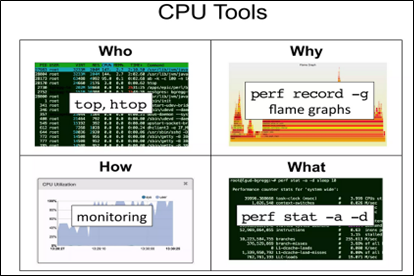
Right. So what the heck’s this Flame Graph thingy? Let’s explore!
We’ll abbreviate Flame Graphs as FG.
There are several types of FGs (CPU, GPU, memory, off-cpu, etc.); here we keep the focus on just one: CPU FGs via Linux’s powerful perf CPU profiler.
The moment a tool can generate profiling data that includes stack traces, it implies that FGs can be generated! Thus, there are several tools besides perf that generate FGs:
Windows: WPA, PerfView, Xperf.exe
Linux: perf, eBPF, SystemTap, ktap
FreeBSD: DTrace
Mac OS X: Instruments
We’ll focus only on using Linux perf; it’s considered one of the best modern CPU profiling tools on the platform
Motivation for FGs
With perf, you can indeed profile your workload and see where exactly CPU usage shoots up. It’s easy: record something, get the report, and analyze it (well… it sounds easy at least).
Example:
Record a system-wide profiling (-a option switch) session with stack chain / backtrace (--call-graph dwarf, old option was -g), frequency of 99 Hz, for 10 seconds:
sudo perf record -F 99 -a --call-graph dwarf -- sleep 10(Instead of the -a option switch, you can use the -p PID option to profile a particular process. The generated perf.data file’s owned by root; do a chown to place its ownership under your account if you wish.)
Get the perf report:
sudo perf report --stdio # or --tui…
(Try it!).
This begs the question – so why not just use perf? Ah, that’s the thing: on non-trivial workloads, the report can be simply humongous, even going into dozens of (printed) pages! Are you really going to read through all of it, trying to spot the outliers?
Visualization with the CPU Flame Graph
It’s why we use the so-called Flame Graph (FG) – to visualize dense textual data and make sense of it; it’s so much clearer (so much more humane, literally).
Installation
First off, ensure both the perf utility and the FlameGraph scripts are installed.
Quick note: to install perf on Ubuntu/Debian, you typically need to be on a distro kernel (not a custom one).Why? Because – unusually for an app – it’s tightly coupled to the kernel it runs on! Assuming you’re on an Ubuntu/Debian distro, do this: sudo apt install linux-perf-$(uname -r) linux-tools-generic (even the linux-tools-generic package might be sufficient).
If you’re on a custom-built kernel, build perf (it’s easy): cd <kernel-src-tree>/tools/perf ; make .
Install FG from here or do (in an empty folder):
git clone --depth 1 https://github.com/brendangregg/FlameGraph.git
Steps to generate a Flame Graph
Profile the workload using perf:
perf record -F 99 --call-graph dwarf [-a]|[-p pid]-a: all cpus; in effect, if specified, the sample is system-wide
-p: sample a particular process.
Generates the perf.data binary file.
Read from perf.data (default, else use -i <fname>) to convert the binary data to human-readable stack traces via perf script:
perf script > perfscript_out.datGenerate the FG, a Scalable Vector Graphic (SVG) file:
The FG repo includes several stackcollapse-* scripts; we use the stackcollapse-perf.pl one:
cat perfscript_out.dat | FlameGraph/stackcollapse-perf.pl \

| FlameGraph/flamegraph.pl > out.svg
Open the SVG in a web browser, move the mouse over stack frames.
A Quick Test Run
We’ll assume you’ve installed both perf and the Flame Graph GitHub repo (the latter under your home dir).
Profile: record everything for 10s
sudo perf record -F 99 -a --call-graph dwarf -- sleep 10sudo chown ${LOGNAME}:${LOGNAME} perf.dataperf script > perfscript_out.datcat perfscript_out.dat | ~/FlameGraph/stackcollapse-perf.pl |~/FlameGraph/flamegraph.pl > out.svgOpen the SVG file in a web browser. Here’s a screenshot of the Flame Graph
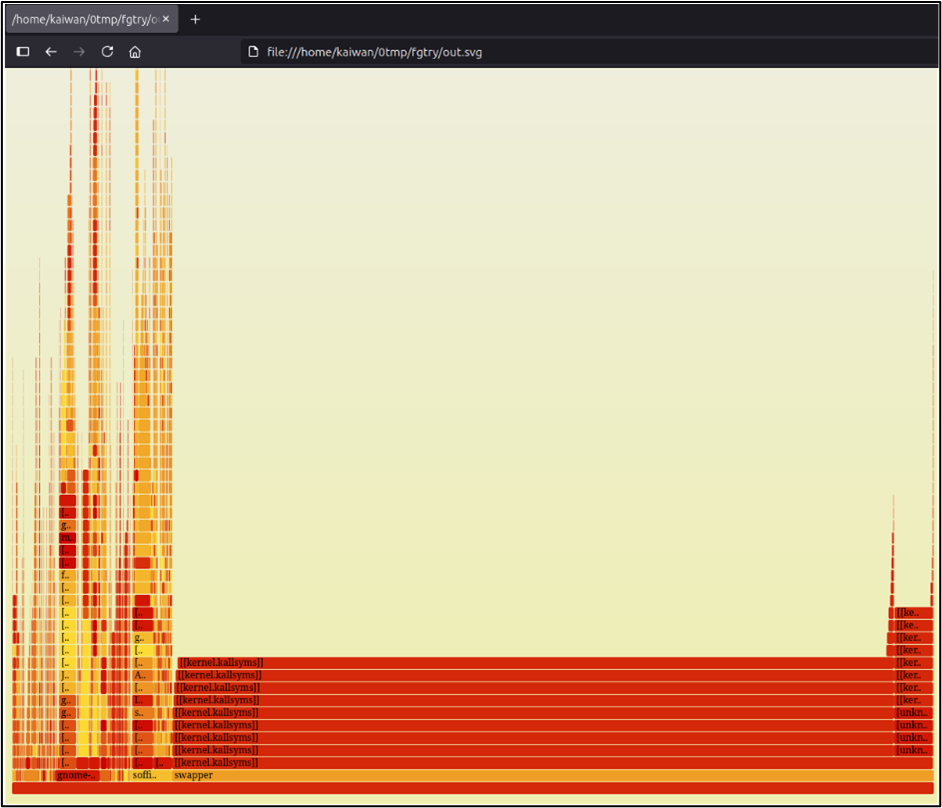
Hmm, better if we zoom in… so I click on one of the rectangles on the lower-left (say on the gnome-shell one):
Ah, better.
Interpreting the Flame Graph
Some really key points regarding how to interpret the Flame Graph:
Each rectangle represents a single stack frame; read it bottom-up.
The width is representative of the frequency of the function call.
The height is representative of the depth of the stack
The order of rectangles from left-to-right is just alphabetical; it's not a timeline.
The colors don’t signify anything special.
You can (typically) use the browser Search (Ctrl-F) to search for a function by name.
Click on a stack frame (a rectangle) to zoom into that tower. Click Reset Zoom (upper-left corner) to zoom back out.
In effect: the hottest code-paths – the ones that dominate - are the widest rectangles!
The top-edge – the rectangle at the very top - is the function on-CPU; beneath is ancestry (how it was invoked).
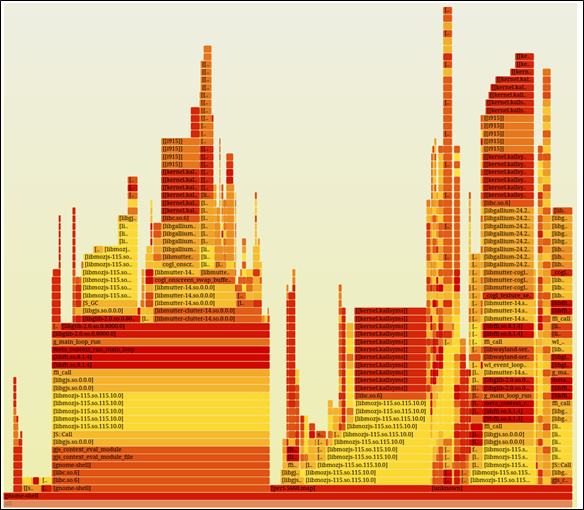
Here’s another FG I captured while SSH was running (truncated screenshot showing the interesting portion):
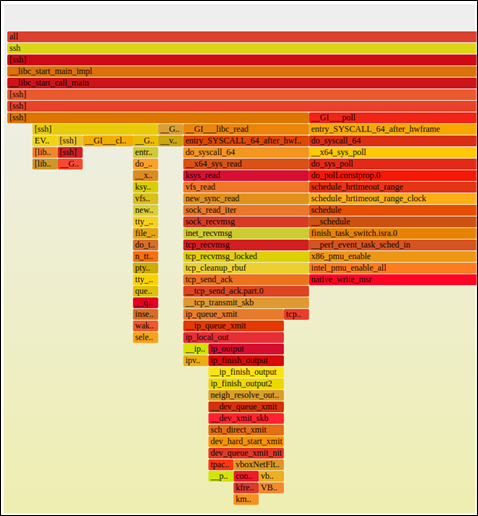
Interesting; the “towers” seem to be inverted! Yes, they’ve becomes top-down (downward-growing stacks) instead of bottom-up… they’re called icicles!
An option to the perf script command sets this up.
A fantastic thing about the FG is that both userspace and kernel-space functions are captured! It’s thus called a mixed-mode FG. For e.g., with the ‘ssh’ FG, you can clearly see the call path leading down to the kernel network protocol stack code – functions from the socket/INET layer sock_*(), followed by L4 tcp_*(), followed by the L3 ip_*() functions; even the invocation of the (network) device transmit – the dev_hard_start_xmit() and others – are visible!
My flamegrapher.sh wrapper scripts
Next, to make this a bit easier to use (no need to remember the syntax, easier options), I wrote a wrapper over the original Flame Graph scripts; the top-level one’s named flamegrapher.sh: https://github.com/kaiwan/L5_user_debug/tree/main/flamegraph (it forms a portion of my ‘Linux Userspace Debugging – Tools & Techniques’ training repo).
It’s Help screen reveals how you can – very easily! – use it to generate FGs:
$ ./flame_grapher.shUsage:
flame_grapher.sh -o svg-out-filename(without .svg) [options ...]
-o svg-out-filename(without .svg): name of SVG file to generate (saved under /tmp/flamegraphs/)
Optional switches:
[-p PID]: PID = generate a FlameGraph for ONLY this process or threadIf not passed, the *entire system* is sampled...
[-s <style>]: normal = draw the stack frames growing upward [default]icicle = draw the stack frames growing downward
[-t <type>]: graph= produce a flame graph (X axis is NOT time, merges stacks) [default]Good for performance outliers (who's eating CPU? using max stack?); works well for multi-threaded apps
chart= produce a flame chart (sort by time, do not merge stacks)
Good for seeing all calls; works well for single-threaded apps
[-f <freq>]: frequency (HZ) to have perf sample the system/process at [default=99]Too high a value here can cause issues
-h|-?: show this help screen.
Note:
After pressing ^C to stop, please be patient... it can take a while to process.
The FlameGraph SVG (and perf.data file) are stored in the volatile /tmp/flamegraphs dir; copy them to a non-volatile location to save them.
Notice a few points:
The only mandatory option switch is -o fname; it generates an SVG file named fname.svg.
There are two ‘types’ of FG’s we can generate:
graph [default]: Produce an FG (X axis is NOT time, merges stacks). This type’s good for performance outliers (who's eating CPU? using max stack?); works well for multi-threaded apps.
chart : Produce a flame chart – it’s sorted by time, do not merge stacks. Good for seeing all calls; works well for single-threaded apps.
You can optionally specify a particular process (by -p PID) to profile, change the style to icicle, and set the profiling frequency.
The metadata and the SVG is stored under /tmp; copy it to a non-volatile location if you want it saved!
(Do read README.md as well. Hey, this wrapper’s lightly tested; please help me (and everyone!) out by raising Issues, as and when you come across them!)
Tip: Try the speedscope.app site to interact with your FlameGraph!
Flame Graphs: Caveats/Issues
Frame Pointers being present helps get good stack traces, BUT the -fomit-frame-pointer is the typical GCC flag passed!
Possible exception case is the Linux kernel itself; it has intelligent algorithms to emit accurate stack trace even in the absence of frame pointers.
Symbols are required (can use a separate symbol file). A side effect of no symbols may be ill-formed (or close to zero) stack traces.
VMs may not support the PMCs (performance measurement counters) that perf requires; in that case, FGs (or perf) don’t really work well.
Bonus material
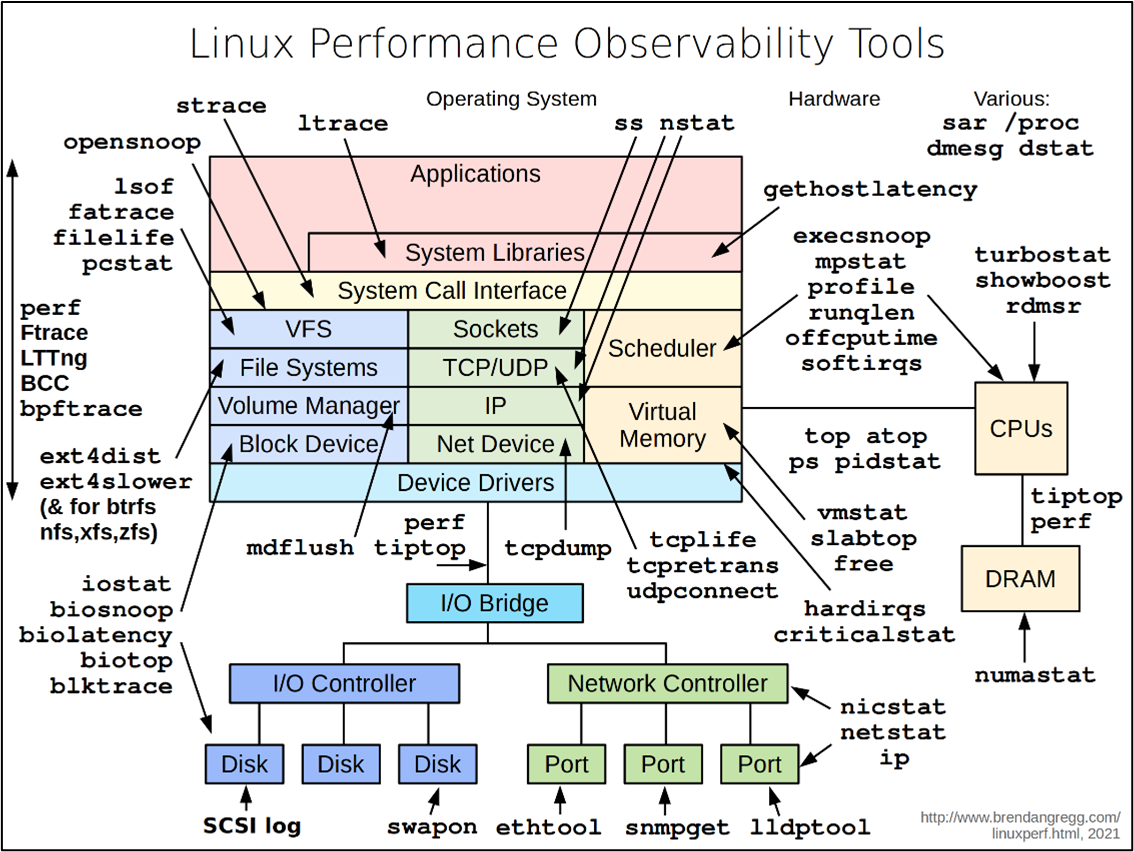
B Gregg’s Linux Performance Observability Tools diagram across the stack!
Tips
With [e]BPF becoming a powerhouse for many things, including observability, do look up equivalent eBPF tooling as well: https://www.brendangregg.com/ebpf.html (a similar diagram’s here!).
Also be sure to check out B Gregg’s (and others) utility package wrappers: perf-tools and bpfcc-tools.
Don’t ignore systemd’s systemd-analyze tool (boot-time).
Perf: simply running sudo perf top is itself useful to find outliers; I keep a couple of aliases as well:
alias ptop='sudo perf top --sort pid,comm,dso,symbol 2>/dev/null'
alias ptopv='sudo perf top -r 80 -f 99 --sort pid,comm,dso,symbol \
--demangle-kernel -v --call-graph dwarf,fractal 2>/dev/null'
If you enjoyed reading this article, check out Kaiwan’s book Linux Kernel Programming!